


Descartes Systems Group, the global leader in uniting logistics-intensive businesses in commerce, released its January Global Shipping Report for logistics and supply chain professionals.
In December 2025, U.S. container import volumes were 2,227,316 twenty-foot equivalent units (TEUs), up 2.0% month-over-month, reflecting typical seasonal stabilization following November’s sharper slowdown.
Total import volumes for 2025 were 0.4% below 2024, despite periods of strength earlier in the year. Imports from China continued to decline in December, down 1.0% month-over-month and 21.8% year-over-year.
China’s share of total U.S. container imports in December was 31.7%, the lowest percentage share in December in the last six years (Dec. 2019: 38.5%, Dec. 2020: 41.6%, Dec. 2021: 41.8%, Dec. 2022: 35.6%, Dec. 2023: 37.4%, Dec. 2024: 38.1%). Port transit time delays improved moderately across East and Gulf Coast gateways while West Coast conditions remained relatively stable, with no signs of broad congestion.
The January update of the logistics metrics monitored by Descartes suggests a cautious global trade environment entering 2026, as broader U.S.-China trade measures, pending Liberation Day tariff rulings and Red Sea security risks create ongoing global supply chain uncertainty.
U.S. container imports finish 2025 slightly below 2024 levels.
December imports posted a modest 2% gain over November but were 5.9% lower than December 2024 (see Figure 1). Total container imports in 2025 were 28,079,201 TEUs, down 0.4% from 28,196,462 TEUs in 2024 and reversing what was nearly 10% year-over-year growth at the start of the year. This gradual softening likely reflects a combination of frontloaded shipments in early 2025, tariff-driven volatility and a potentially cooling economic environment, which collectively narrowed and ultimately eliminated annual container import growth.
Figure 1. U.S. Container Import Volume Year-over-Year Comparison
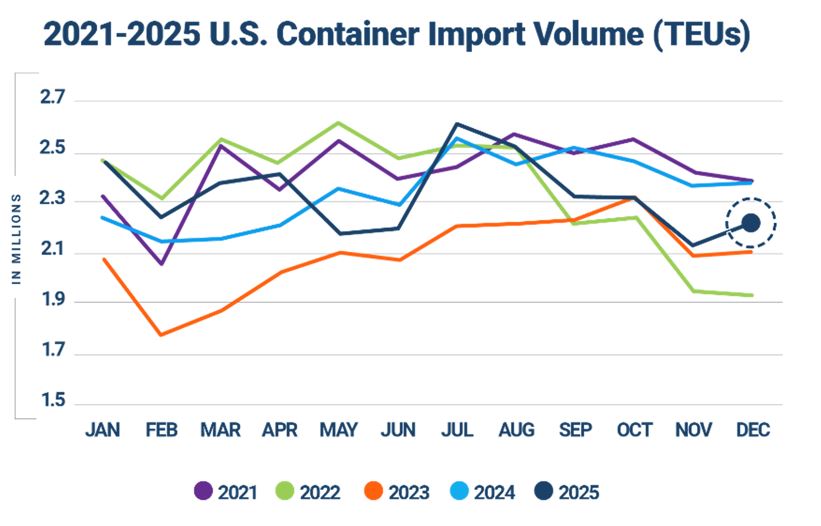
Source: Descartes Datamyne™
China-driven weakness continues to weigh on year-over-year volumes from top 10 countries of origin (CoO).
In December 2025, U.S. containerized imports from the top 10 CoO declined 8.4% year-over-year, with a combined decrease of 143,200 TEUs (see Figure 2). The contraction was driven primarily by China, which fell 21.8% (196,730 TEUs) and accounted for more than the total net decline. Additional year-over-year decreases were recorded from India (15.0%), Taiwan (13.2%), South Korea (7.1%) and Italy (1.0%). In contrast, several Southeast Asian origins posted strong year-over-year growth. Thailand increased 28.3% (24,511 TEUs), Vietnam 21.5% (48,889 TEUs), and Indonesia 19.6% (9,527 TEUs). More modest gains were recorded from Japan (1.7%) and Hong Kong (1.1%).
Figure 2. December 2024 to December 2025 Comparison of U.S. Import Volumes from Top 10 Countries of Origin
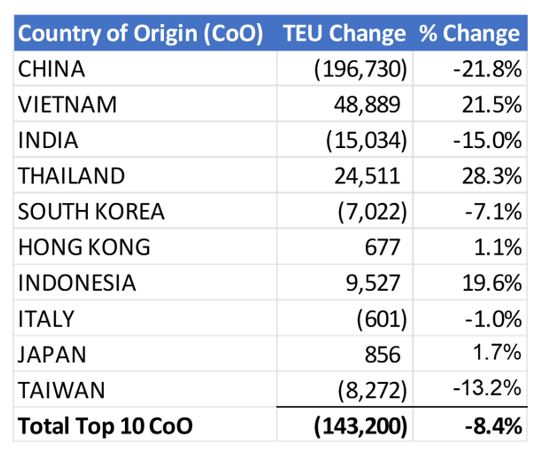
Source: Descartes Datamyne™
“For U.S. importers, 2025 was a year marked by volatility, uncertainty and slightly softening demand compared to 2024,” said Jackson Wood, Director of Industry Strategy at Descartes. “As the new year begins, global supply chains continue to grapple with numerous factors weighing on logistics costs and complexities, including ongoing tariff uncertainty, uneven sourcing shifts, and elevated geopolitical risk from Venezuela developments and the Russia/Ukraine, Israel/Hamas and Iran/Israel conflicts.”
Descartes began its global shipping analysis in August 2021. To read past monthly reports, learn more about the key economic and logistics factors driving global shipping, and review strategies to help address challenges in the near-, short-, and long-term, visit Descartes’ Global Shipping Resource Center.
 Supply Chain Planning: What, Why and How
 Why Circular Manufacturing is Becoming a Business Necessity
 Retailers now seeing real impact of cost of living crisis
 Talkdesk Flexible Shopping Solution Helps Retailers Break Down Channel Silos
 Neurala & IHI Logistics & Machinery Partner to Deliver First-of-its-Kind AI in Materials & Logistics Handling
 CTS Announces Security Partnership With Mandiant