


Descartes Systems Group, the global leader in uniting logistics-intensive businesses in commerce, released its June Global Shipping Report for logistics and supply chain professionals.
In May 2026, U.S. container import volumes increased by 6.6% over April to 2,428,758 twenty-foot equivalent units (TEUs), signaling stronger import demand following April’s slowdown. China-origin imports rebounded sharply, rising 19.9% month-over-month and 28.1% year-over-year. Overall performance at the top 10 U.S. ports remained stable, even as they combined to capture 89.9% of total imports in May, the highest share since March 2023.
The global trade environment remains highly uncertain, with ongoing instability in the Strait of Hormuz and Red Sea, new U.S. tariff proposals and ongoing U.S.–China trade tensions. The June update of the logistics metrics monitored by Descartes reinforces a global shipping environment defined by volatility, shifting sourcing strategies and heightened costs.
May U.S. container imports reflect typical seasonal growth.
May imports were up 6.6% over April and 11.5% compared to May 2025. The month-over-month increase aligns with the seasonal growth pattern typically observed in May. Since 2016, May import volumes have exceeded April levels in all but two years: 2020 and 2025. For the first five months of the year, volumes are down 1.9% compared to the same period in 2025 and up 16.4% compared to the same period in pre-pandemic 2019.
Figure 1. U.S. Container Import Volume Year-over-Year Comparison
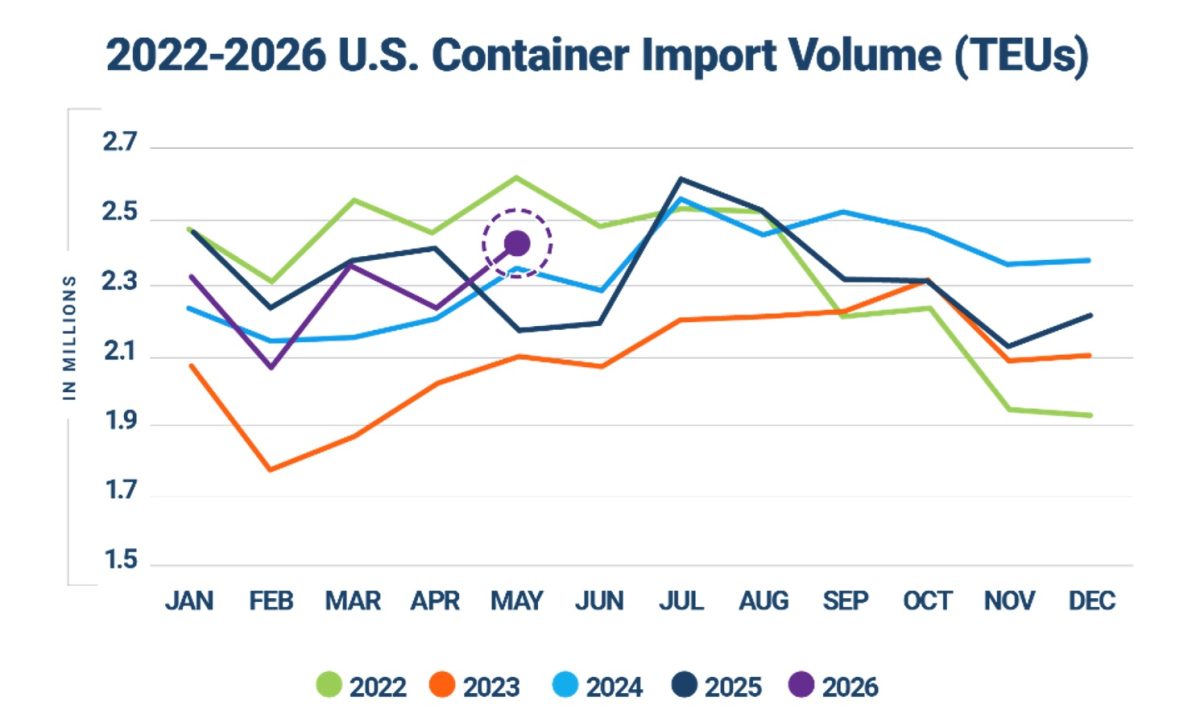
Source: Descartes Datamyne™
China-led growth drives increase in imports from top 10 countries of origin (CoO).
May U.S. containerized imports from the top 10 CoO increased 8.2% (129,528 TEUs) month-over-month, driven primarily by a strong rebound in imports from China, with growth supported by several other major sourcing markets (see Figure 2). China volumes were up 135,419 TEUs (19.9%), followed by India, up 20,158 TEUs (22.2%), Vietnam, up 16,035 TEUs (6.3%) and Hong Kong, up 10,164 TEUs (15.9%). Germany and Italy also posted modest gains. Declines were recorded in Thailand, down 27,040 TEUs (19.1%), Japan, down 15,438 TEUs (23.9%), Indonesia, down 10,868 TEUs (16.8%) and South Korea, down 5,382 TEUs (5.3%).
Figure 2. April 2026 to May 2026 Comparison of U.S. Import Volumes from Top 10 Countries of Origin
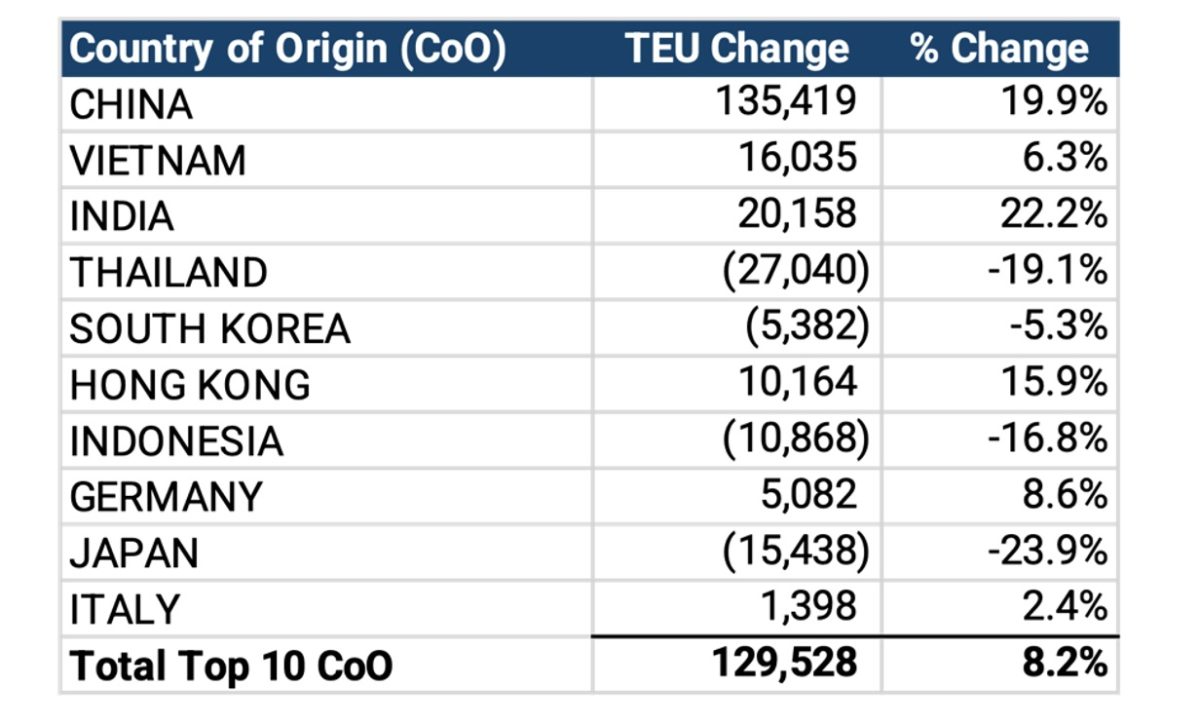
Source: Descartes Datamyne™
“Despite a highly uncertain global trade environment, U.S. containerized import trends remain positive over the first five months of the year,” said Jackson Wood, Director of Industry Strategy at Descartes. “As numerous major factors add complexity to sourcing and cost-management decisions, including ongoing Strait of Hormuz disruptions, new U.S. tariff proposals and U.S.-China trade tensions, U.S. importers remain focused on managing supply chain risk and resiliency to stay agile amid persistent volatility.”
Managing supply chain risk
Descartes began its global shipping analysis in August 2021. To read past monthly reports, learn more about the key economic and logistics factors driving global shipping, and review strategies to help address challenges in the near-, short-, and long-term, visit Descartes’ Global Shipping Resource Center.
 New Report Reveals Companies Lacking Global Presence Will Lose Growth Opportunities
 CSR is good for business, an independent consulting study reports, but official targets & policies are lagging behind
 Infios recognized as Customers’ Choice in 2025 Gartner® Peer Insights™ Voice of the Customer for WMS
 Smart Solutions in the Hands of Manufacturers: The ‘Remote’ Route to Zero Machine Downtime
 Reasons your supply chain can’t afford to wait: agility, resiliency & sustainability
 ‘Right to Repair’ will need a ‘Right-size’ approach