


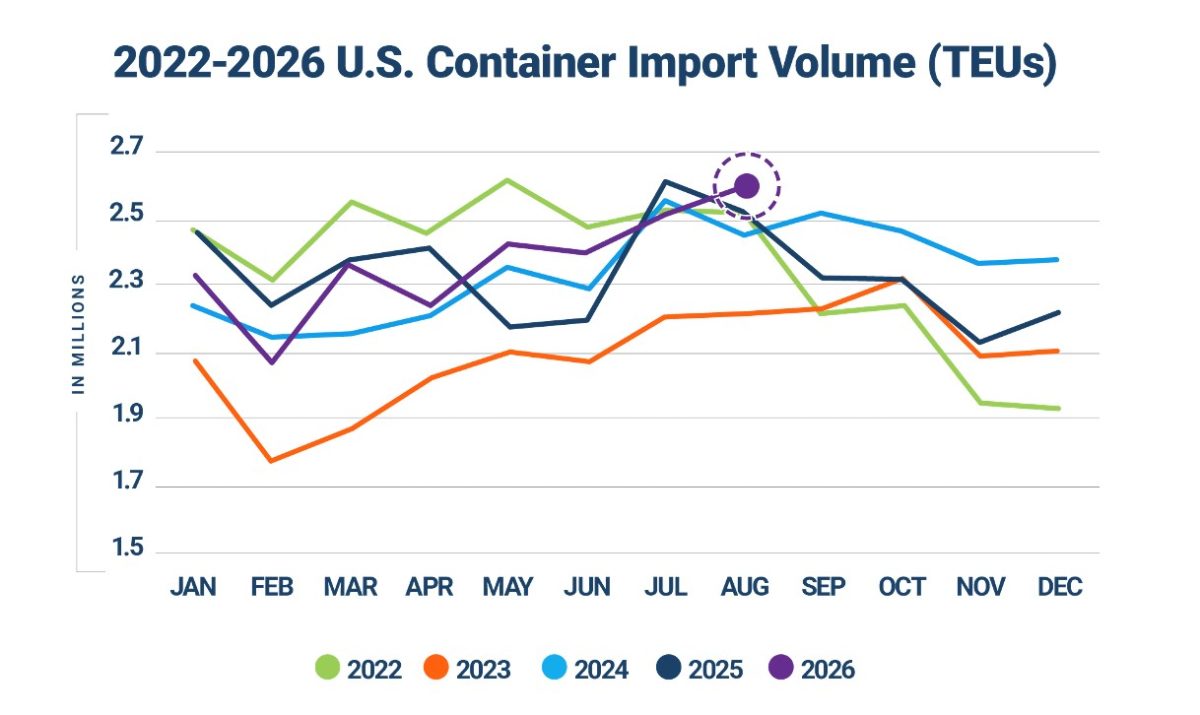
Descartes Systems Group, the global leader in uniting logistics-intensive businesses in commerce, released its September Global Shipping Report for logistics and supply chain professionals. August 2026 U.S. container import volumes increased 3.8% over July to 2,603,709 twenty-foot equivalent units (TEUs), the third-highest monthly volume on record behind only May 2022 and July 2025.
China-origin imports increased a modest 1.3% over July, while imports from the top 10 countries of origin (CoO) rose 3.5% month-over-month and 2.3% year-over-year, reflecting broad growth across leading sourcing markets. August port transit delays increased across all major U.S. gateways.
The September update of the logistics metrics monitored by Descartes highlights the resilience of U.S. maritime imports in the face of ongoing trade risk.
August U.S. container imports reach third-highest monthly level on record.
August 2026 imports were up 3.8% over July (see Figure 1), trailing only May 2022’s record 2,622,465 TEUs and July 2025’s 2,621,910 TEUs. August imports were 3.3% higher than in August 2025 and 21.5% above pre-pandemic August 2019, underscoring the strength of U.S. import demand. Through the first eight months of 2026, import volumes were 0.4% below the same period in 2025, continuing to narrow the year-to-date gap.
Figure 1. U.S. Container Import Volume Year-over-Year Comparison
China-origin imports rise modestly in August.
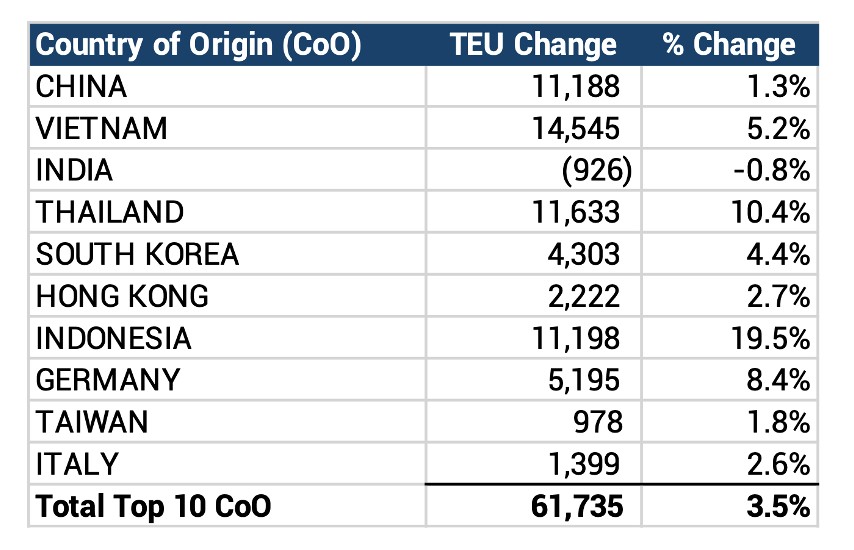
Imports from China totaled 884,318 TEUs in August 2026, increasing 1.3% from July and 1.7% from August 2025. As a percentage of total U.S. container imports, China volumes were down from 34.8% in July to 34.0% in August, as imports from other sourcing countries grew more quickly. August imports from the top 10 CoO increased 3.5% month-over-month (see Figure 2). Vietnam recorded the largest volume increase, rising 14,545 TEUs (5.2%), followed by Thailand, up 11,633 TEUs (10.4%); Indonesia, up 11,198 TEUs (19.5%); and China, up 11,188 TEUs (1.3%). Germany increased 5,195 TEUs (8.4%), South Korea rose 4,303 TEUs (4.4%), and Hong Kong gained 2,222 TEUs (2.7%). More modest increases were recorded for Italy and Taiwan. India was the only country to decline, falling 926 TEUs (0.8%).
Figure 2. July 2026 to August 2026 Comparison of U.S. Import Volumes from Top 10 Countries of Origin
Source: Descartes Datamyne™
“At 2.6M TEUs, August’s elevated volumes demonstrate that U.S. import demand remains strong, with growth across most leading sourcing countries and ports,” said Jackson Wood, Director of Industry Strategy at Descartes. “At the same time, rising port delays, tighter Panama Canal capacity, expanded tariff exposure, and persistent disruption in the Middle East and Red Sea are increasing supply chain complexity. Timely trade intelligence and flexible sourcing and routing strategies remain key strategies to help importers manage costs and respond effectively as conditions change.”
Descartes began its global shipping analysis in August 2021 to help importers manage supply chain risk. To read past monthly reports, learn more about the key economic and logistics factors driving global shipping, and review strategies to help address challenges in the near-, short-, and long-term, visit Descartes’ Global Shipping Resource Center.
 Loftware Announces Enterprise Labeling Solution for the Medical Device Industry
 The 6 Best Industrial Marking Machine Manufacturers
 BP Mitchell lowers insurance premiums with new Durite camera kits
 OpenText Extends Leadership in Global Digital Commerce with Business Network Cloud
 The Benefits of Outsourcing Auditing Services
 Great Bear Driver Wins Microlise Driver of the Year 2022