

No single market performs well all the time, which is why many traders and investors explore multiple markets for the best returns. While some assets need less frequent monitoring, others require a more hands-on approach and frequent checks.
Essentially, it’s important to access charts, watchlists and portfolios across devices without sacrificing data quality.
Modern browser-based charting frameworks are designed with advanced technologies such as Web Graphics Library (WebGL) that seamlessly deliver desktop-class performance directly within a web browser while maintaining compatibility across smartphones and other devices with high-resolution displays.
This article explores how current browser-based charting frameworks streamline multi-asset market tracking.
Understanding browser-based charting frameworks
Browser-based charting frameworks are JavaScript or TypeScript libraries that transform raw data into interactive, visual graphs and dashboards directly in a web browser. They handle rendering, animations, and responsiveness using web technologies like HTML5 Canvas, SVG, or WebGL. Popular charting platforms like TradingView allow users to customize and interact with charts as a result of high-level libraries such as HTML5 Canvas and WebGL frameworks.
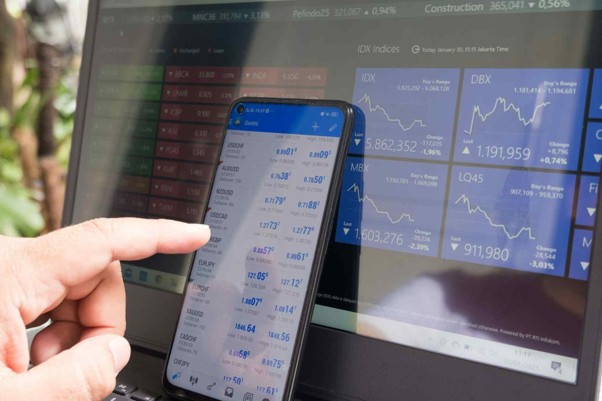
Browser-based charting frameworks fall into two main categories depending on your needs. High-level libraries, such as those used by TradingView, are preferred for quick drop-in charts for instant visualizations. On the other hand, low-level frameworks work well for highly customized or data-heavy visualizations.
Since most of the processing occurs within the browser, users can access the same interface regardless of whether they’re using Windows, macOS, Linux, Android, or another operating system. Users can track their watchlists, chart layouts, and portfolios, which are usually synchronized across devices through cloud storage. For investors who monitor several asset classes, this creates a simple workflow that improves accessibility to quality real-time market data.
Why WebGL dominates multi-asset tracking platforms
Multi-asset tracking involves monitoring multiple assets across different markets. For example, monitoring the oil market typically involves analyzing assets including WTI (US oil), Brent crude, currencies like the US dollar and Canadian dollar, and energy-sector equities. While basic browser charts provide simple price charts and technical indicators, they can become extremely slow when rendering large datasets or multiple charts that synchronize with each other.
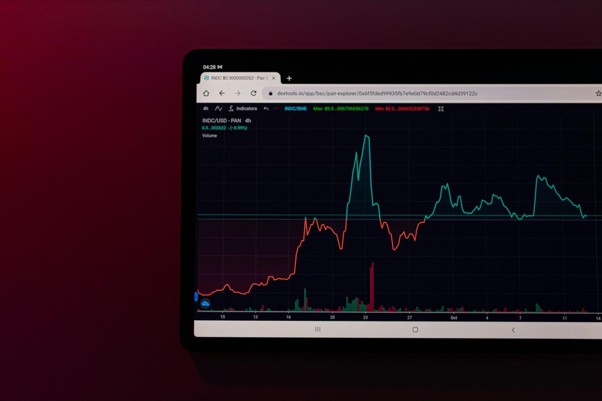
Advanced charting platforms overcome these limitations by using graphics technologies like WebGL. WebGL is a JavaScript API for rendering high-performance interactive 2D and 3D graphics within a compatible web browser. It uses a device’s GPU to render thousands of data points smoothly. This allows for:
- Responsive multi-chart layouts within a single interface
- Faster rendering of technical indicators and overlays
- Smooth zooming and panning across large historical datasets
- Real-time updates with minimal lag during periods of high market activity
- Simultaneous monitoring of multiple asset classes without performance degradation
- Crisp high-resolution visuals
- And consistent performance across smartphones, tablets, desktops, and multi-monitor workstations
Using TradingView as a case study, picture a trader seated in front of a four-monitor workstation. One screen tracks US oil and Brent crude; another displays EUR/USD and USD/CAD; a third follows selected energy stocks, while the fourth streams economic calendars and breaking market news. As new data arrives, due to WebGL technology, every chart updates simultaneously, making it easier to spot how a stronger US dollar pressures oil prices or how rising crude influences energy stocks. The cloud dashboards equipped with TradingView software also allow users to map complex multi-asset correlations on a single, responsive layout.
Assume the trader leaves the workstation and continues monitoring the same cloud-saved dashboards from a smartphone. All chart layouts, watchlists, and analysis remain synchronized across every device, removing the need to recreate the trading environment on another device. This seamless transition shows exactly how browser-based charting platforms streamline multi-asset tracking across devices.
WebGL is built directly into browsers and does not require plugins. However, users who have the feature disabled will be unable to access charts requiring the functionality on their browser.
How to enable WebGL on your browser for enhanced multi-asset market tracking
WebGL helps graphical elements run correctly in your web browser. The charting framework is usually enabled by default in some browsers, but in some cases, it needs to be enabled manually. If you don’t have it enabled, you will get an error message saying “WebGL Disabled” when trying to view charts that require WebGL rendering.

Here’s how to enable it on Chrome and Chromium-based browsers like Brave, Edge, and Opera:
Before getting started, it’s important to note that the latest versions of Google Chrome come with WebGL enabled by default. Update to the latest version if your browser is outdated. If WebGL isn’t automatically enabled, then:
- Go to Settings and navigate to “System” settings.
- Enable “Use hardware acceleration when available.”
- Click the Relaunch button that appears to apply the settings to the browser.
For Apple Safari:
- On macOS, open Preferences and tap Advanced.
- Navigate to “Develop” in the menu bar.
- Open “Experimental features” and enable WebGL or WebGL 2.0
- In some cases, you may need to use the terminal to enable WebGL. To do this, paste ‘defaults write com.apple.Safari WebKitPreferences.webGLEnabled 1’ without the quotation marks in your terminal.
- For iOS on the iPhone or iPad, navigate to settings and tap on Safari.
- Open Advanced to access Experimental Features and toggle WebGL 2.0 if available.
The process is similar across other browsers. However, if graphics still fail to load, it’s advisable to consult the browser’s official WebGL support documentation or explore. You can test if your browser supports WebGL at this official site in a single click and also toggle off from there to the appropriate support documentation for your browser.
Where Multi-Asset Tracking Goes From Here
Tracking multiple assets is now commonplace among traders, investors, financial analysts, and other market participants. Multi-asset market tracking covers evaluating multiple assets from a single interface as well as viewing different assets across various devices. Whichever strategy is in play, several browser-based charting frameworks, especially WebGL, ensure users can synchronize data, whether single or multi-layout, across various devices.
 Microsoft CTO – Travel & Transport – to Speak at Microlise Transport Conference 2022
 How Digital Currency is Influencing the Online Poker Industry
 Manhattan Associates Elevates In-Store Customer Service with Expanded Customer Engagement Solution
 Manhattan Pioneers Use of GenAI in Supply Chain Commerce
 Manufacturing on Demand: How 3D Printing is changing the Industry
 Randex launches vertical storage lift online planning service, claims industry first