


Descartes Systems Group, the global leader in uniting logistics-intensive businesses in commerce, released its October Global Shipping Report for logistics and supply chain professionals. In September 2025, U.S. container import volumes were 2,307,933 twenty-foot equivalent units (TEUs), down 8.4% from August and 8.4% below September 2024. Imports from China fell to 762,772 TEUs, down 12.3% month-over-month and 22.9% year-over-year. Port transit time delays showed mixed results with overall minor improvements in September as volumes declined from August. The October update of the logistics metrics monitored by Descartes suggests that tariff volatility continues to create trade uncertainty, while global supply chains also contend with ongoing geopolitical disruptions.
U.S. container imports decline in September, though remain relatively strong year-to-date.
September imports decreased 8.4% over August and were 8.4% below September 2024 (see Figure 1). While the month-over-month decline is consistent with seasonal patterns in eight of the last 10 years, the steeper drop this year potentially highlights heightened sensitivity to tariff deadlines as importers continue to adjust shipment flows in response to policy changes. For the first nine months of 2025, volumes are tracking 1.9% ahead of the same period in 2024, highlighting that, despite September’s decline, import activity remains relatively strong this year.
Figure 1. U.S. Container Import Volume Year-over-Year Comparison
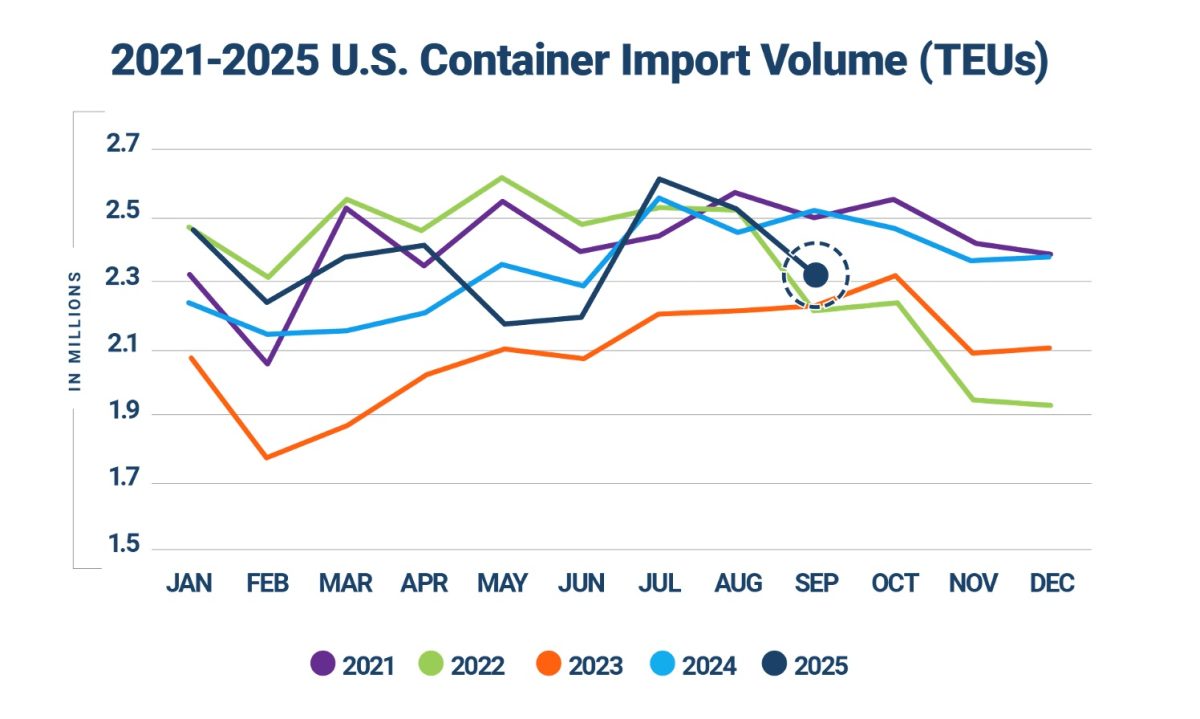
Source: Descartes Datamyne™
Imports from the top 10 countries of origin (CoO) fell 9.4% month-over-month for a combined decline of 169,126 TEUs (see Figure 2). The decrease was led by China, which dropped 106,751 TEUs, a decline of 12.3% month-over-month and 22.9% year-over-year. Year-over-year, many of China’s leading import categories have registered losses of more than 20%. Aluminum and articles thereof (HS-76) posted the steepest contraction, down 43.8%. Toys and sporting goods (HS-95) dropped 32.8%, footwear (HS-64) 33.9%, and electric machinery (HS-85) 31.5%. Apparel categories also weakened sharply, with knit apparel (HS-61) down 31.9% and non-knit apparel (HS-62) down 29.1%. Articles of iron or steel (HS-73) decreased 24.6%, vehicles (HS-87) 23.5%, and glassware (HS-70) 28.3%. Furniture and bedding (HS-94), the largest import category from China, fell 22.3% year-over-year, though it maintained a 14.5% share of all China-origin imports.
Figure 2. August 2025 to September 2025 Comparison of U.S. Import Volumes from Top 10 Countries of Origin
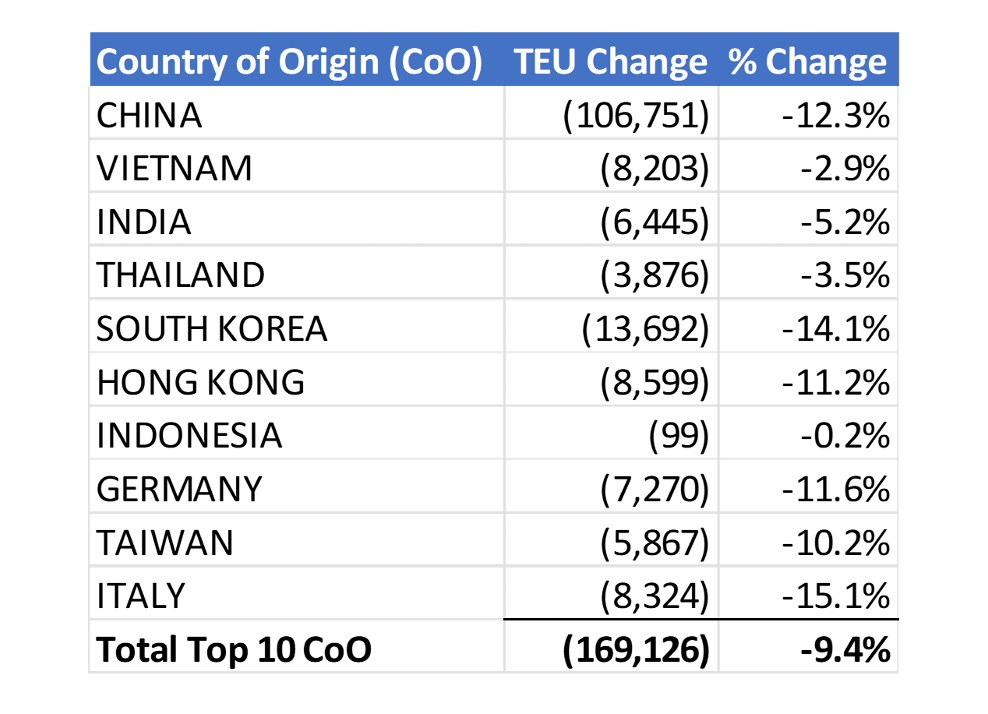
Source: Descartes Datamyne™
“After two months of elevated volumes, U.S. container imports dropped in September, led by a significant pullback in volumes from China,” said Jackson Wood, Director of Industry Strategy at Descartes. “September’s decline underscores the combined impact of seasonal softening and tariff-related caution. With the 90-day tariff truce between the two countries set to expire in mid-November, China’s share of U.S. imports remains sensitive to both policy outcomes and underlying market dynamics.”
Descartes began its global shipping analysis in August 2021. To read past monthly reports, learn more about the key economic and logistics factors driving global shipping, and review strategies to help address challenges in the near-, short-, and long-term, visit Descartes’ Global Shipping Resource Center.
 Journey to the Cloud
 RENOVOTEC LAUNCHES SPRING PROMOTION FOR HONEYWELL’S NEW DOLPHIN CK65 RUGGED MOBILE COMPUTER
 An Ultimate Guide to Write a Supply Management Contract
 The Most Promising Online Planner of 2023
 AI for Good: How Artificial Intelligence Is Transforming Charity Work
 Keplin & eBusiness Guru (eBG) Bring Live Social Commerce to the Stage at Linn Academy 2025