


Descartes Systems Group, the global leader in uniting logistics-intensive businesses in commerce, released its July Global Shipping Report for logistics and supply chain professionals. In June 2026, U.S. month-over-month container import volumes decreased by a slight 1.2% to 2,400,627 twenty-foot equivalent units (TEUs), reflecting typical seasonal easing. China-origin imports held steady in June, down just 0.2% from May. Port transit delays in June improved across East and Gulf Coast gateways but almost doubled at Los Angeles where volumes rose 16.1%. The July update of the logistics metrics monitored by Descartes suggests that, while overall import volumes remain stable, geopolitical events and tariff changes will likely continue to be the biggest drivers of supply chain decisions through the second half of 2026.
June U.S. container imports ease slightly from May.
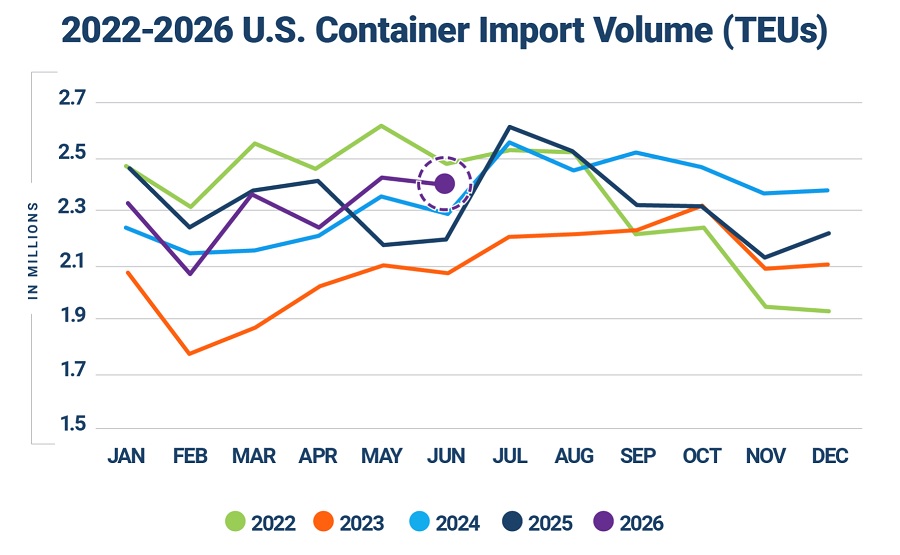
June imports were down 1.2% over May but were up 8.2% compared to June 2025 (see Figure 1). The month-over-month decrease aligns with the seasonal decline typically observed in June. For the first six months of the year, volumes are down a slight 0.3% compared to the same period in 2025 but up by a more significant 22.2% compared to the same period in pre-pandemic 2019.
Figure 1. U.S. Container Import Volume Year-over-Year Comparison
Source: Descartes Datamyne™
Top 10 countries of origin (CoO) imports remain nearly flat in June.
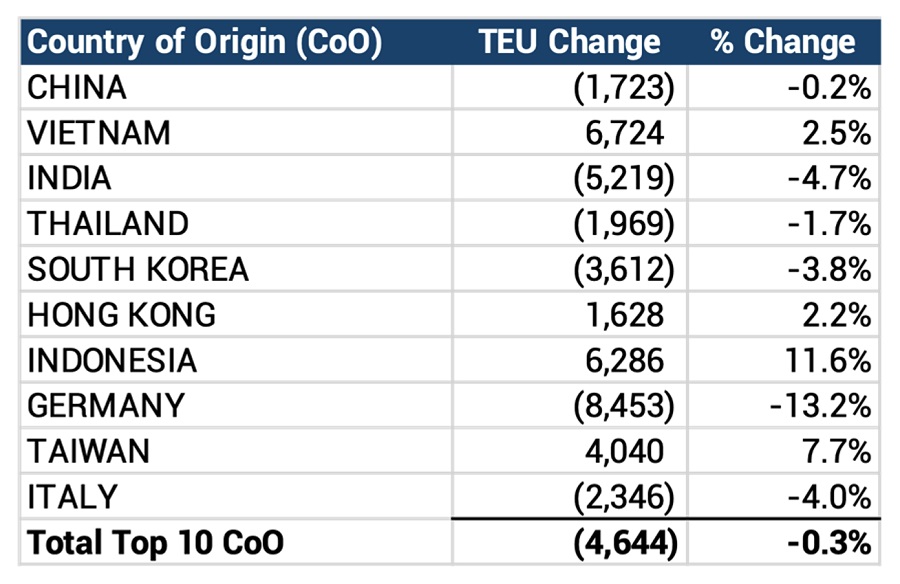
June U.S. containerized imports from the top 10 CoO decreased just 0.3% (4,644 TEUs) month-over-month (see Figure 2). China was essentially flat, declining 1,723 TEUs (0.2%) after May’s sharp rebound. Vietnam posted the largest volume gain, rising 6,724 TEUs (2.5%), followed by Indonesia, up 6,286 TEUs (11.6%), Taiwan, up 4,040 TEUs (7.7%), and Hong Kong, up 1,628 TEUs (2.2%). Germany recorded the largest decline, down 8,453 TEUs (13.2%), followed by India, down 5,219 TEUs (4.7%), South Korea, down 3,612 TEUs (3.8%), Italy, down 2,346 TEUs (4.0%), and Thailand, down 1,969 TEUs (1.7%). Overall, June’s slight decline suggests that import activity from leading sourcing markets stabilized following May’s China-led rebound.
Figure 2. May 2026 to June 2026 Comparison of U.S. Import Volumes from Top 10 Countries of Origin
Source: Descartes Datamyne™
“Over the first six months of the year, aggregated U.S. containerized imports showed little variance compared to the same period last year,” said Jackson Wood, Director of Industry Strategy at Descartes. “However, as we head into the second half of 2026, global trade continues to face high levels of volatility from Middle East maritime risk, elevated tariff uncertainty, new Panama Canal draft restrictions and ongoing Red Sea disruption. For U.S. importers, sourcing diversification, landed cost visibility and risk mitigation remain key strategies to manage in this environment.”
Descartes began its global shipping analysis in August 2021 to help importers manage supply chain risk. To read past monthly reports, learn more about the key economic and logistics factors driving global shipping, and review strategies to help address challenges in the near-, short-, and long-term, visit Descartes’ Global Shipping Resource Center.
 The Future of Accounting: How AI is Transforming Tax Preparation
 Apex Announces Strategic OEM Relationship with Zebra Technologies
 What Are the Legal Exceptions for Barefoot Driving?
 Delivering on sustainable customer expectations
 TruTac Makes Compliance Control Easy for Gwynedd Shipping
 Winners lift their LEEA Awards and raise the industry