

Most conversations about retail performance focus on the visible metrics: conversion rates, basket size, promotional uplift, margin per category. Demand forecasting accuracy rarely makes it onto the executive dashboard. It sits somewhere in the planning team’s spreadsheets, measured inconsistently if at all, and treated as a technical problem rather than a strategic one.
That framing is expensive. Forecast errors compound through the supply chain in ways that are difficult to attribute directly to their source — stockouts look like a replenishment failure, overstock looks like a buying mistake, promotional waste looks like a merchandising problem. The actual cause, a forecast that did not reflect what customers were going to buy, is several steps removed from the outcome and easy to overlook.
Retail demand forecasting accuracy is not a technical metric buried in a planning system. It is the upstream input that determines whether the right products are in the right place at the right time — and getting it right is the single lever with the most untapped potential in most retail supply chains today.
What Demand Forecasting Accuracy Actually Means in Practice
Forecast accuracy retail teams typically measure it as the difference between what was predicted and what was actually sold over a given period, expressed as a percentage error at the SKU or category level. A 90% accuracy rate sounds reasonable until you consider what the remaining 10% costs across a chain of 150 stores and 30,000 SKUs.
The more useful framing is not the percentage itself but what the inaccuracy produces operationally. A forecast that is 15% too high on a slow-moving SKU creates three weeks of excess inventory. A forecast that is 20% too low on a high-velocity line during a promotional period creates a stockout on the exact week demand peaks. Both are forecast accuracy problems, but they look completely different when they hit the P&L.
Demand forecasting in retail supply chains operates across multiple time horizons simultaneously. There is the long-range forecast used for buying and supplier commitments, the medium-range forecast that drives replenishment and distribution planning, and the short-range forecast that governs store-level orders. Errors at the long-range stage propagate forward and are difficult to correct. Errors at the short-range stage are more recoverable but still costly.
The compounding nature of these errors is what makes the importance of demand forecasting accuracy so high relative to the attention it typically receives.
The Actual Cost of Inaccurate Retail Forecasting
Global inventory distortion — the combined cost of stockouts and overstock — reached an estimated $1.7 trillion in 2024 according to industry research. That figure covers both sides of the forecasting error spectrum: too little stock where demand was higher than expected, and too much stock where demand was lower.
For a mid-size retail chain, the practical expression of that problem is familiar: planners spend a significant portion of each week manually correcting orders the system got wrong, safety stock is set conservatively across the board to compensate for forecast uncertainty, promotional orders are padded because no one trusts the uplift model, and markdowns at season end absorb margin that better forecasting would have protected.
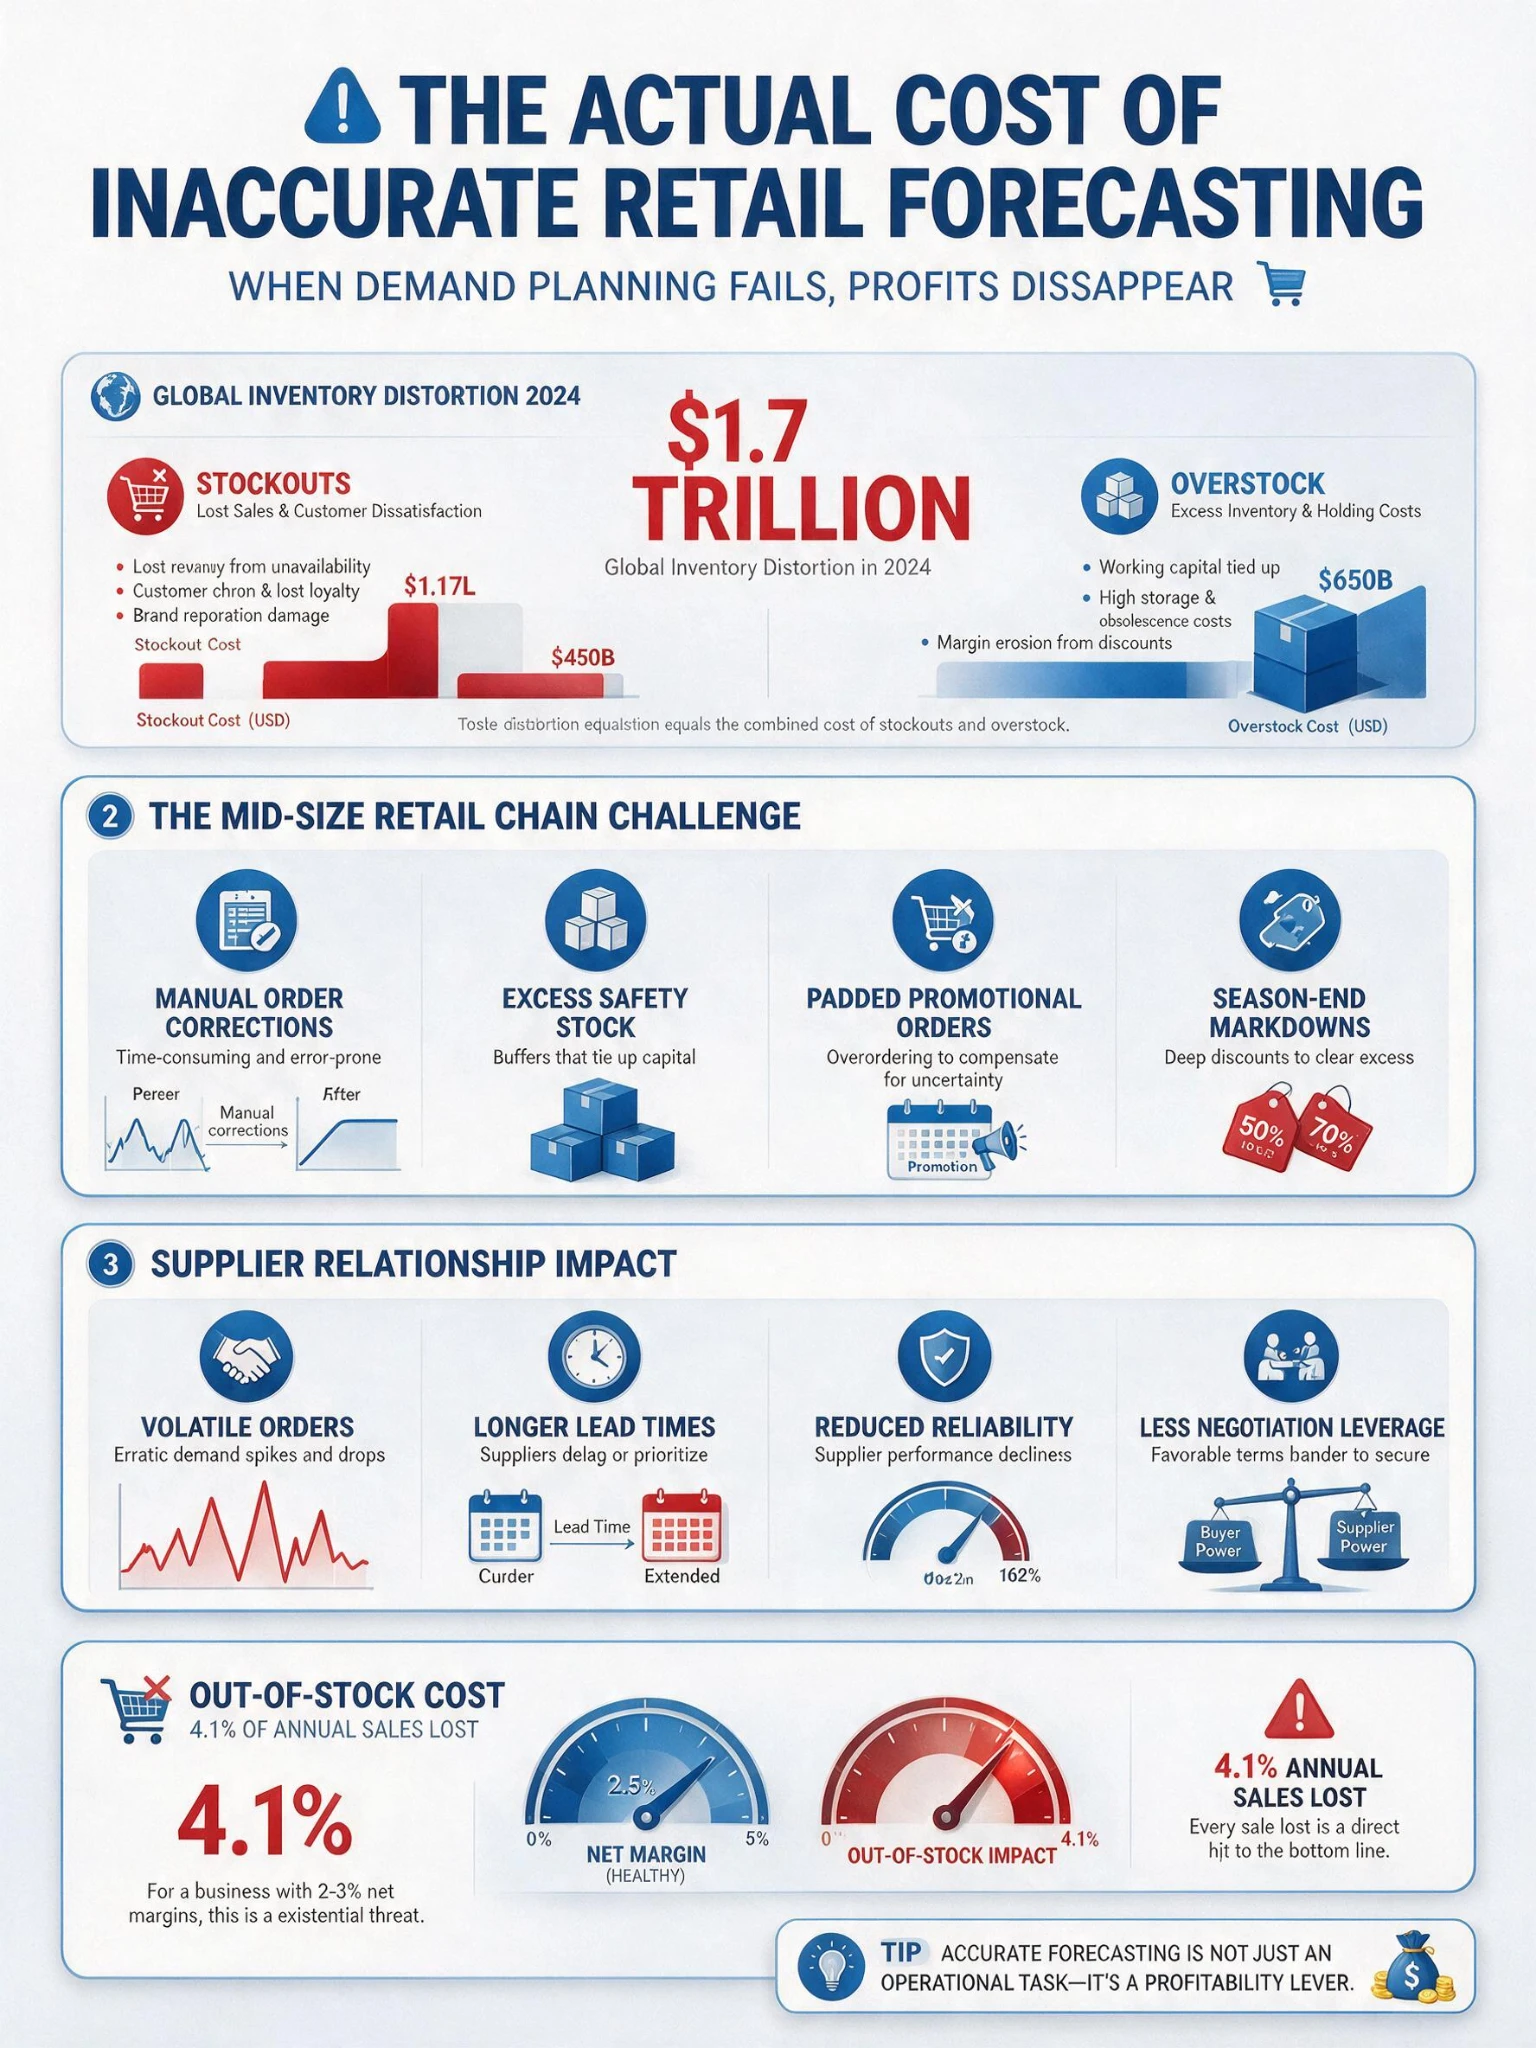
Retail demand forecasting accuracy also directly affects supplier relationships. Volatile and unreliable orders make it difficult for suppliers to plan production and allocate capacity. The downstream effect is longer lead times, reduced reliability, and less leverage in commercial negotiations — all of which make the accuracy problem harder to solve.
Out-of-stock situations alone cost retailers approximately 4.1% of total annual sales on average. For a business operating on a 2–3% net margin, a loss of that magnitude at the top line is not a planning inconvenience. It is a structural drag on profitability that cannot be offset through operational efficiency elsewhere.
Why Most Retailers Are Underinvesting Here
Given the scale of the problem, the question worth asking is why retail demand forecasting accuracy does not receive more strategic attention and investment.
Part of the answer is attribution. The benefits of better forecasting are distributed across multiple functions — buying, planning, logistics, store operations — rather than captured in a single line on a P&L. When the forecast improves, overstock falls, but the saving appears in working capital, not in a forecasting budget. When stockouts reduce, the avoided lost sales do not show up anywhere. The improvement is real, but it is spread across the organisation in ways that make it hard to measure and therefore hard to justify investment against.
A second factor is the way retail teams tend to measure forecast accuracy. Averaging error across large SKU groups or long time periods masks the specific inaccuracies that actually matter. A category with 85% average forecast accuracy can still generate significant stockouts if the 15% error is concentrated on the top 20% of SKUs by velocity. Aggregate accuracy metrics obscure rather than reveal the problem.
The third factor is the role of legacy systems. Many retail businesses still rely on ERP-embedded forecasting modules that use relatively simple statistical methods — moving averages, seasonal indices set annually, and safety stock buffers sized by rule of thumb. These methods work reasonably well in stable environments. They perform poorly under promotional complexity, demand volatility, new product introduction, and the kind of external disruption that has characterised retail conditions for several years.
What Separates High-Accuracy Forecasting from the Rest
The retailers with consistently strong forecast accuracy retail performance share a set of characteristics that go beyond the technology they use.
- The first is granularity. Accurate forecasting happens at the SKU-store level, not at the category or chain level. Aggregating demand before forecasting loses the signal that matters — the specific behaviour of a specific product in a specific location. Chains that have moved to location-level forecasting consistently outperform those that forecast centrally and distribute results downward.
- The second is the treatment of causal factors. Standard statistical forecasting models demand based on its own history. Causal forecasting incorporates the factors that drive demand: price changes, promotions, competitor activity, weather, local events, and channel shifts. The inclusion of causal variables is particularly important for demand forecasting in retail supply chains with active promotional calendars, where the promotional uplift can be three to five times the baseline and a static model has no mechanism to anticipate it.
- The third is the speed of model recalibration. Forecasting models that are recalibrated annually or quarterly cannot keep pace with how retail demand actually evolves. The best approaches recalibrate continuously, incorporating recent sales data to update the model before the lag between the real world and the forecast becomes operationally significant.
- The fourth is how exceptions are handled. Even the best forecasting systems produce errors. The difference between a well-run forecasting process and a poorly run one is not the absence of errors — it is how quickly errors are detected and corrected. Retailers with strong forecast accuracy retail performance have exception management processes that surface the highest-impact inaccuracies and prioritise planner attention toward them rather than distributing effort evenly across the assortment.
The AI Shift in Retail Demand Forecasting
The importance of demand forecasting accuracy has driven significant investment in AI-based approaches over the past five years, and the gap between AI-native forecasting and traditional statistical methods has become substantial in specific areas.
AI models can process far more input variables than statistical methods, incorporating point-of-sale data, web search trends, social signals, supplier lead time variability, and external market data alongside historical sales. They can detect non-linear relationships between variables that statistical models cannot model. And they can recalibrate in near real time rather than on a fixed schedule.
In categories with high demand variability — fresh food, fashion, seasonal products — AI-driven forecasting consistently reduces error rates relative to traditional approaches. The gains are less dramatic in stable, slow-moving categories, where simpler methods already perform adequately.
The practical barrier for many retailers has been the cost and complexity of implementing AI forecasting. That barrier has come down significantly as purpose-built platforms have developed. For teams beginning to evaluate options, there are several demand forecasting software solutions available specifically for retail that cover both AI-driven forecasting and the replenishment automation that depends on it — comparing them on retail-specific capabilities rather than general ML credentials tends to produce more useful evaluations.
How to Start Closing the Accuracy Gap
Improving retail demand forecasting accuracy does not require replacing all existing planning infrastructure simultaneously. The highest-impact starting points tend to be consistent across retail businesses of different sizes and categories.
Measure accuracy at the right level of granularity first. If you are currently measuring at category or chain level, move to SKU-location level measurement. This step alone will surface the specific areas of inaccuracy that are driving the most operational impact — and it often reveals that the aggregate accuracy figure is concealing significant variation across the assortment.
Clean the input data before changing the model. Forecast accuracy is constrained by data quality. Promotion history, lost sales records, product range changes, and store-level anomalies all affect the training data available to any forecasting model. Gaps and errors in this data produce errors in the forecast regardless of how sophisticated the algorithm is.
Identify the categories where accuracy improvement delivers the highest return. In most retail businesses, 20% of SKUs drive 80% of the financial impact of forecast errors. Prioritising forecasting investment toward high-velocity, high-margin, and high-variability categories generates faster measurable returns than broad improvement across the full assortment.
Build exception management into the planning process. The goal is not to reduce planner involvement — it is to redirect planner attention toward the highest-impact decisions rather than distributing it evenly across thousands of routine orders that the system handles well.
The Lever That Most Retailers Have Not Pulled
Retail supply chains have absorbed significant investment in automation, logistics optimisation, and store technology over the past decade. Demand forecasting in retail supply chains has received less attention, despite being the upstream input on which most of those downstream investments depend.
A faster distribution network cannot compensate for orders that were wrong before they were placed. A sophisticated replenishment system cannot recover margin lost because the forecast failed to anticipate a demand spike. The accuracy of the forecast is the constraint that limits the effectiveness of everything downstream.
Closing the forecast accuracy gap will not happen through a single technology decision or a process change in isolation. It requires treating retail demand forecasting accuracy as a strategic discipline — measuring it with the same rigour applied to financial metrics, investing in the capabilities that improve it, and building the organisational processes that sustain improvement over time.
For most retail supply chains, this remains largely undone. That is precisely what makes it the biggest untapped lever available.
 Cosmetics Manufacturer ARTDECO Optimizes E-Commerce Shipping with LYDIA Voice
 Best practices for growing your buyers’ network during times of disruption
 Is AI in Recruitment Smart Hiring, or Backfiring?
 SOCAR Terminal Goes Live with Navis N4
 Neopost brings automated answer for profitable packaging to UK
 Gatewatcher announces two new Sales Directors for UK & Ireland and Benelux & Nordics