


Descartes Systems Group, the global leader in uniting logistics-intensive businesses in commerce, released its August Global Shipping Report for logistics and supply chain professionals. July 2026 U.S. container import volumes increased 4.5% over June to 2,508,310 twenty-foot equivalent units (TEUs), reflecting typical month-over-month seasonal growth. China-origin imports increased 7.2% over June, reaching their highest monthly level since July 2025. July port transit delays increased across most major U.S. gateways, while Los Angeles delays improved sharply. The July update of the logistics metrics monitored by Descartes underscores the resilience of U.S. maritime imports in the face of ongoing trade policy and geopolitical uncertainty.
July U.S. container imports follow seasonal month-over-month increase.
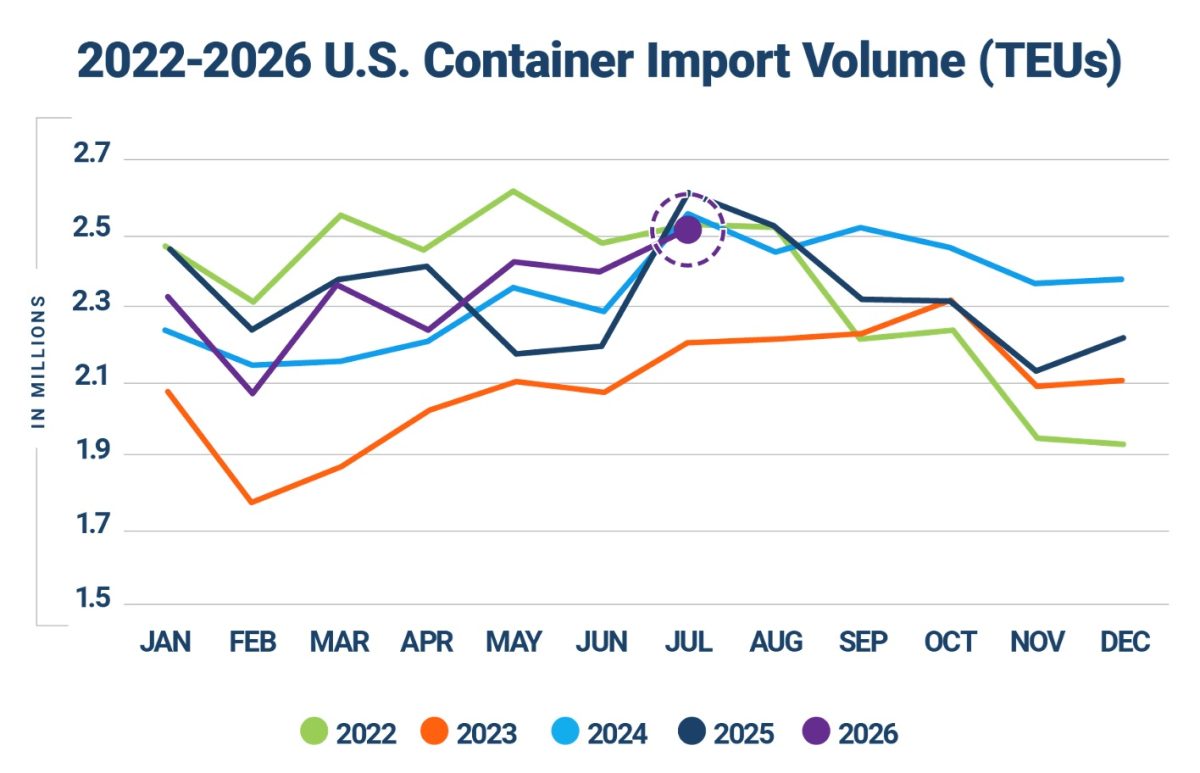
July 2026 imports were up 4.5% over June (see Figure 1), consistent with the peak shipping season increase observed every July over the past decade. Year-over-year, July imports were down 4.3%; however, trade policy, combined with seasonal demand, led to suspected aggressive frontloading in July 2025 when volumes reached 2,621,910 TEUs. For the first seven months of the year, volumes were down a slight 0.9% compared to the same period in 2025 but up by 14.1% compared to the same period in pre-pandemic 2019.
Figure 1. U.S. Container Import Volume Year-over-Year Comparison
Source: Descartes Datamyne™
China drives July increase in imports from top sourcing countries.
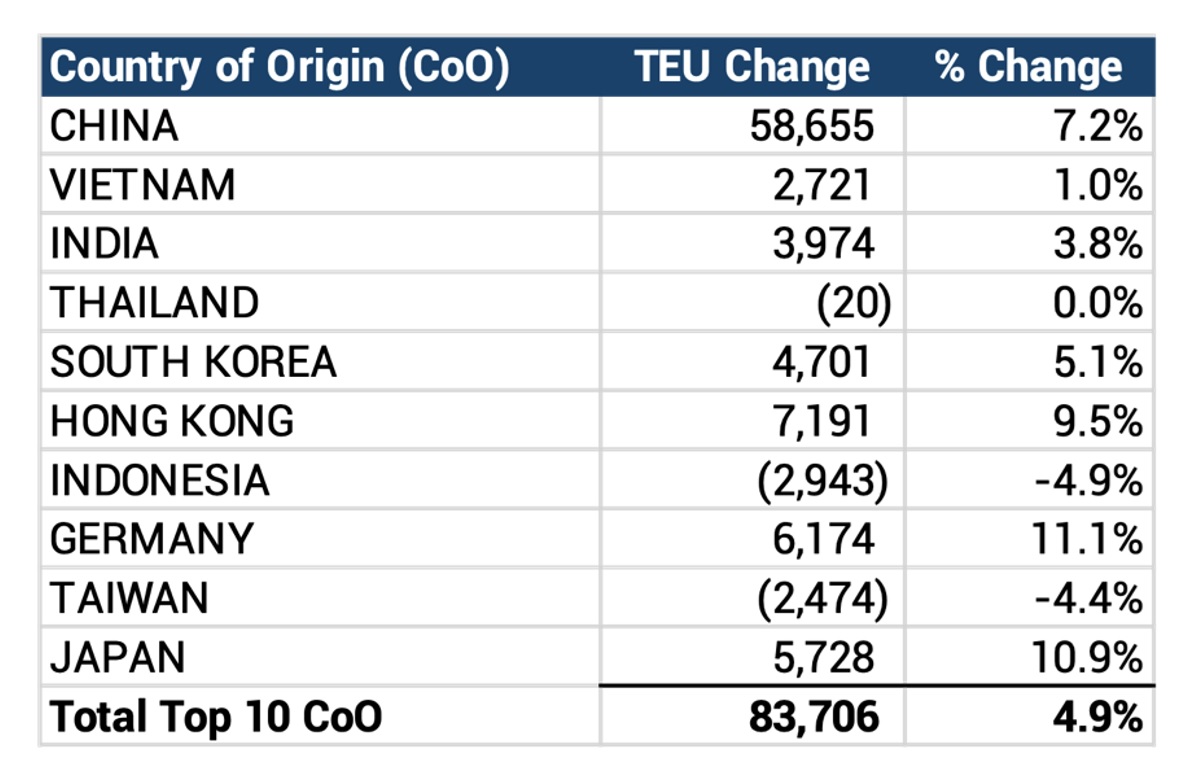
July U.S. containerized imports from the top 10 countries of origin (CoO) increased 4.9% month-over-month for a combined increase of 83,706 TEUs (see Figure 2). China recorded the largest volume gain, increasing 58,655 TEUs (7.2%) to its highest monthly total since July 2025. Other notable increases came from Hong Kong, up 7,191 TEUs (9.5%), Germany, up 6,174 TEUs (11.1%), Japan, up 5,728 TEUs (10.9%), South Korea, up 4,701 TEUs (5.1%), and India, up 3,974 TEUs (3.8%). Vietnam also posted a modest increase of 2,721 TEUs (1.0%), while Thailand was essentially unchanged. The only declines among the top 10 sourcing countries were Indonesia, down 2,943 TEUs (4.9%), and Taiwan, down 2,474 TEUs (4.4%). Overall, July results point to a broad-based strengthening in import activity across major sourcing markets, led by China.
Figure 2. June 2026 to July 2026 Comparison of U.S. Import Volumes from Top 10 Countries of Origin
Source: Descartes Datamyne™
“July’s import growth shows that demand remains resilient amidst a highly complex and challenging operating environment,” said Jackson Wood, Director of Industry Strategy at Descartes. “As changing tariffs, elevated Middle East maritime risk, tighter Panama Canal draft restrictions and continued Red Sea disruption continue to affect costs, capacity and schedule reliability, having flexible sourcing and routing strategies will help U.S. importers respond quickly as conditions evolve.”
Descartes began its global shipping analysis in August 2021 to help importers manage supply chain risk. To read past monthly reports, learn more about the key economic and logistics factors driving global shipping, and review strategies to help address challenges in the near-, short-, and long-term, visit Descartes’ Global Shipping Resource Center.
 How to Obtain a Gaming License: A Complete Guide for iGaming Businesses
 Why Self-Serve Company Swag Stores Are the Future of Employee Gifting
 UK’s retail landscape has shifted significantly over the last 24 months
 New research reveals how scammers keep cyber extortion attacks under the radar
 Sparck Technologies awarded Royal designation
 FRAYT Hits Milestone -15,000 Owner-operator Drivers and Delivery Vehicles